

The latest AirDNA data shows a healthy Poconos short-term rental market, but one that is becoming more selective. Revenue, occupancy and average daily rates are increasing as the number of active listings experiences a slight decline.
When compared with KeyData’s Q3 2026 regional analysis, the message becomes clearer: revenue growth is increasingly being driven by pricing power and property quality—not by an unlimited increase in demand.
Poconos revenue is rising while inventory declines
According to AirDNA, Revenue per Available Rental, or RevPAR, increased 7.3% in the Poconos during the past 12 months. Average annual revenue rose 8.5% to approximately $55,200.
Other regional performance indicators include:
- 43% occupancy, up 2.3%
- $397 average daily rate, up 4.5%
- 6,581 active listings, down 3.0%
- AirDNA’s Pocono Region Market Score of 86 (reflects strong business opportunity)
- AirDNA Seasonality Score of 72 (reflects a good revenue flow year-round)
More revenue is being captured by a smaller pool of available properties. That is encouraging for strong operators, but it does not mean every Poconos rental is benefiting equally.
How the Poconos compares with the Mid-Atlantic
KeyData’s U.S. Key Data Index Q3 2026 provides a broader comparison for the Mid-Atlantic region, which includes Pennsylvania, New York, New Jersey, Delaware and Maryland.
During the second quarter of 2026, KeyData reported:
- 29% paid occupancy
- $296 average daily rate
- Flat year-over-year occupancy
- 12% growth in average daily rate
- 12% growth in RevPAR
The AirDNA and KeyData figures are not directly interchangeable. AirDNA’s Poconos figures are market-specific trailing indicators, while KeyData’s numbers cover a much larger five-state region and a defined quarterly period. The platforms may also differ in methodology and property coverage.
Even with those limitations, both datasets point in the same direction: revenue is increasing faster than occupied nights. Operators with pricing power are capturing the gains.
The Poconos’ $397 ADR is substantially higher than KeyData’s $296 Mid-Atlantic benchmark, although the difference partly reflects the Poconos’ concentration of whole-home leisure properties. The region’s 43% AirDNA occupancy is also higher than KeyData’s 29% Mid-Atlantic paid occupancy, but these percentages should not be treated as an exact apples-to-apples comparison.
The more meaningful comparison is the trend. KeyData found flat Mid-Atlantic occupancy but 12% growth in both ADR and RevPAR. AirDNA found modest Poconos occupancy growth alongside higher ADR, RevPAR and annual revenue.
Both suggest that guests are willing to pay more for the right product.
The strongest Poconos submarkets
AirDNA assigns the overall Poconos a Market Score of 86. Several submarkets scored higher:
- Jim Thorpe: 98
- Mt Pocono: 95
- Canadensis: 92
- East Stroudsburg: 91
- Stroudsburg: 89
- Lake Harmony: 87
- Pocono Lake and Emerald Lakes: 86
Jim Thorpe received the highest Submarket Score, supported by strong revenue-growth potential, rental demand and steady seasonality metrics. Its average annual revenue was approximately $45,558, with 48% occupancy and a $283 ADR.
Mt Pocono generated the strongest headline results, with average annual revenue of $69,979 and the region’s highest occupancy rate at 57%. Its ADR was $361. However, AirDNA identified only 24 active listings in that submarket, so the averages may be influenced by a relatively small number of high-performing properties.
East Stroudsburg combines stronger scale with high performance. Its 685 active listings generated average annual revenue of $62,277, a $402 ADR and 47% occupancy. Annual revenue increased 15% even as active inventory declined 18.8%. Included in this submarket is Middle Smithfield Township and the community of Saw Creek Estates.
Stroudsburg followed a similar pattern. Average annual revenue increased 15.4% to $56,937, occupancy rose 12.1% to 51%, and active inventory declined 22.9%. This notable decline in inventory can be attributed to an unfavorable regulation score.
These results reinforce the idea that revenue is concentrating among stronger properties while weaker listings exit the market.
Premium nightly rates remain achievable
Lake Harmony reported the highest ADR among the reviewed Poconos submarkets at $448.96. Its average annual revenue was $61,515, despite occupancy of only 41%. In AirDNA’s definition of sub-markets, Lake Harmony includes much of Penn Forest Township and thus has 1486 active listings making it the largest sub-market according to AirDNA.
Emerald Lakes followed with a $439.17 ADR and $60,084 in average annual revenue. Pocono Lake reported a $422.93 ADR and $57,725 in annual revenue. The submarket of Tobyhanna has 1281 active listings and includes large communities like Pocono Farms Country Club, Pocono Farms East and A Pocono Country Place.
Occupancy alone does not determine investment performance. A distinctive property capable of commanding premium nightly rates can produce strong annual revenue without being occupied every night. The Poconos is historically a late booking weekend-focused market, two metrics that investors are looking to change.
KeyData’s regional results support this conclusion. Mid-Atlantic occupancy was flat, but ADR and RevPAR each increased 12%. Stronger rates—not a surge in booked nights—produced the revenue growth.
Seasonality still matters
Across the Poconos, the best month is July and the worst month is March. AirDNA gives the region a Seasonality Score of 72.
A high Seasonality Score indicates relatively low seasonality and more consistent demand throughout the year. A low score indicates greater seasonality and larger differences between peak- and low-season revenue.
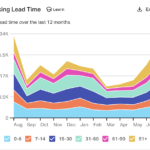 Poconos vacation rentals are generally strongest during summer and fall. Demand slows considerably during the “mud season,” typically running from early March through late April.
The ski season is the biggest variable. Homes very close to ski resorts can perform extremely well from December through March. Properties more than approximately 20 minutes from skiing generally receive less winter demand.
A ski-adjacent property may enjoy both a winter peak and strong summer and fall seasons. A more distant property may rely heavily on warm-weather travel, foliage season, holiday weekends and its own amenities.
KeyData’s booking-window data adds another consideration. Nationally, finalized booking windows averaged 49 days in April, 56 days in May and 67 days in June. This supports publishing attractive peak-season rates and availability well in advance, followed by active pricing adjustments as arrival dates approach. In the Poconos, the average booking window is much lower, the AirDNA data shows many months with over half the bookings made less than 30 days before arrival.
A flight to quality
It is our opinion that these results reflect a move toward luxury—a flight to quality.
The trend is toward larger and more expensive homes, better interior design, stronger amenities and a more premium guest experience than the region has historically provided.
Guests increasingly compare professional photography, bedroom capacity, ample bathrooms, large open gathering areas, outdoor features and entertainment options before booking. Homes with hot tubs, game rooms, pools, attractive kitchens, modern bathrooms and well-designed outdoor spaces have a meaningful competitive advantage and of course, 5-star ratings.
Older-looking, smaller and outdated homes are not renting as well. Lowering the nightly rate does not appear to be solving the problem for many of these owners and operators.
KeyData’s national Demand Index was essentially flat in June 2026, while its Revenue Index remained positive. That is consistent with a mature and competitive market: total demand is no longer expanding fast enough to make every property successful, but revenue can still grow for homes that give guests a compelling reason to choose them.
An expensive amenity is not automatically a profitable amenity. Improvements should be evaluated according to their likely effect on ADR, occupancy, guest reviews and annual revenue. Nevertheless, the data supports investing in upgrades that create visible differentiation.
Distribution and presentation are increasingly important
KeyData found that Airbnb accounted for 51% of national reservations during Q2 2026, up from 47% one year earlier. Airbnb’s share of revenue increased from 36% to 43%.
Vrbo remained relatively stable at 20% of reservations and 23% of revenue. Direct bookings represented 21% of reservations and 29% of revenue.
For Poconos operators, the lesson is not to rely exclusively on one channel. Owners should maintain strong Airbnb and Vrbo listings while gradually developing repeat-guest and direct-booking opportunities.
Professional photography, thoughtful descriptions, strong reviews, responsive management and disciplined pricing are now core elements of property performance—not optional marketing extras.
Luxury and Quality is Growing in Poconos Real Estate
The current vacation-rental environment is also reflected in the Poconos real estate market.
Active STRs with high bedroom counts, high permitted guest occupancy, turnkey condition and a strong presence on booking platforms are in very high demand. These properties are selling at substantial premiums because buyers are acquiring more than a house. They are acquiring a furnished hospitality product with amenities, photography, reviews, operating history and potentially forward reservations.
Buyers should still verify the business carefully. A high platform rating does not replace municipal permits, HOA approval, legal occupancy documentation, septic capacity, revenue statements and confirmation of what will transfer at closing.
A property should be underwritten according to the number of bedrooms and guests that can legally be licensed—not simply the occupancy advertised in a listing.
The bottom line
The Poconos remains a strong vacation-rental destination, but performance is becoming more concentrated.
AirDNA shows improving occupancy, ADR, RevPAR and annual revenue while active inventory declines. KeyData shows the broader Mid-Atlantic producing strong ADR and RevPAR growth without increased occupancy.
Together, the reports support a clear conclusion: future success will depend less on simply owning a Poconos rental and more on owning the right one.
The strongest opportunities are likely to be well-located, legally compliant, high-capacity and professionally presented properties that deliver a memorable guest experience and can command a premium nightly rate. Generic, dated homes that compete primarily by lowering price face an increasingly difficult market.
Methodology note: AirDNA figures reflect the supplied Poconos market and submarket screenshots. KeyData statistics are drawn from its Q3 2026 analysis of Q2 performance and forward booking data. The Mid-Atlantic region includes Pennsylvania, New York, New Jersey, Delaware and Maryland and should not be interpreted as Poconos-only performance.
